First, here's some notes on our current status:
- Our 4255 cases per 1M people ranks us at number 3 in our 22 country sample (Singapore and Spain are the two with higher rates)
- Our 252 fatalities per 1M ranks us 6th
- We have now tested over 29,000 tests per million people for COVID - almost 3% of our population. While other countries have higher per-capita numbers, our 9.6 Million overall tests is more than 3 times the next closest country (Germany).
- We are now at 25 days to double and that number is going up every one or two days. On April 1, we were doubling in 4 days.
- We are 18 days out from our peak case day of 38,790
- We are 26 days out from our peak deaths day of 6,088
While this graph is a little chaotic, it shows how most countries positive test rates for COVID are going down:
Singapore's rate is the one that is obviously climbing. Canada is just leveling out. You can see that the US test rate peaked several weeks ago and is on a good downward trend.
When we look at regional growth, you still see the tropical and southern countries very flat relative to the northern countries.
The two exceptions are Chile and Singapore. About half of Chile's population lives in the area around Santiago, but I don't have an explanation for their anamalous growth compared to neighbor Argentina. I noted last week that Singapore uses much more air conditioning than other tropical countries on this chart. That may be a factor, but there are certainly many other possibilities.
Focusing on the US, I calculated the number of COVID cases that have recovered I used an average of 21 days to recovery that is the consensus of several studies. If you subtract the recoveries and fatalities from the total cases, you can also see the number of active cases.
From this graph, you can see that there are currently more people who have recovered from COVID in the US than active cases. Also, the number of active cases slowed around a month ago and peaked on April 25th at 621,872. Since then the number of active cases has been dropping. If we look at the daily case and fatality rates, we also see that our peaks are weeks behind us:
Finally, our testing is headed in the right direction. The number of tests per day has grown to three times its rate since the beginning of April while the % of positive cases continues to drop.
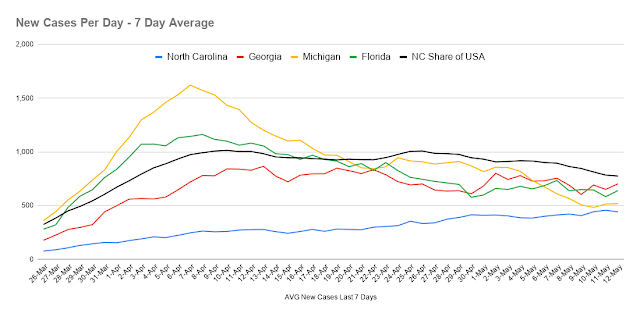
Looking at North Carolina,
Our new cases per day remains the lowest among our peer set, although we have been increasing while others have been going down. Some of that is because of the increased testing we've been doing, but these other states have also increased testing rates. Our daily mortality rate remains one of the lowest per-capita in the country and its a good sign that the others are trending our way.
By the way, all these graphs and the data behind them are updated daily. The world graphs are here, the national graphs here, and the NC Graphs are here. Here's a comparison of testing:
Florida has increased its rate, but they have twice our population so you would expect more testing. Michigan would be a higher priority for testing because of their more severe COVID situation. North Carolina is about 30% off the national pace and is testing at a lower pace than some of the other states, but to the extent these tests are prioritized at a national level, we have a relatively mild COVID situation so you would expect more tests to go to states in greater crisis. When we look at the positive test rate, we also see that NC has always had a relatively low positive rate and that the other states are starting to catch up.
Looking at the combination of daily testing rate and positive testing, we see that the lighter trend lines are in the right directions (testing up, positive rate down). This is one of the key indicators NC is using to determine if its okay to go to the next phase of reopenings.
Finally, I have also added NC county-by-county data to my COVID data set. A sortable summary is here. Here are some interesting facts:
- 89% of counties are 7 days or more from their peak case date
- 85% are 7 days or more from their peak death date
- 93% are more than 7 days to double
- 16% haven't had a new case in at least a week
- Charlotte's county, Mecklenburg, has almost 25% of the entire state's cases and more than twice the next closest state.
- The NC Prison system has more cases than all but 4 counties and one of those counties (Wayne) has many of the prison cases.


No comments:
Post a Comment